How we picked the ML model that powers your forecast. A look behind the curtain at 15+ models, 4 000 chanterelle observations from County Mayo, and the 2025 fair examination.
In 2021 the chanterelle peak in Ireland fell in September. In 2025 the peak was in July. Two months apart, same species, same country. Calendars don’t always line up, weather shifts year to year, and last year’s diary doesn’t always repeat. In County Mayo our team has collected more than 4 000 verified chanterelle observations over six years, and in 2025 we took that dataset and put 15 different ML models through a fair examination. This article is about how we compared them, who won, and why you are now using exactly this model in ShroomCast.
Why predict mushrooms at all
The forest is not a calendar. Look at chanterelle observations across Ireland over the last 7 seasons in one chart:
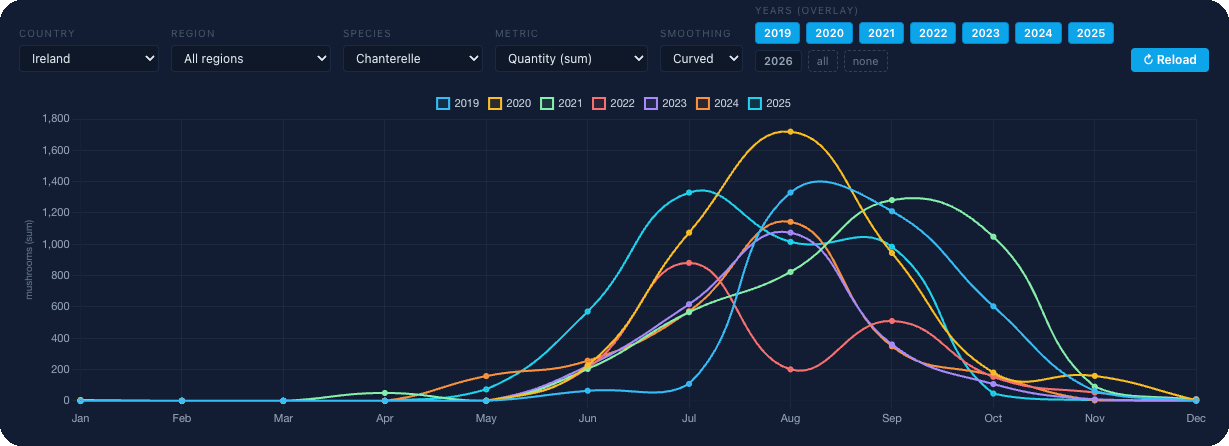
In 2021 you would have driven to the forest in July and found only moss. In 2025 you would have waited for September and missed the peak by six weeks. This is not a one-off anomaly, this is the norm: temperature, rainfall, soil moisture, forest type, lunar cycles, each of these shifts fruiting by days and weeks, and their combined effect can drag the peak of the season from July to September and back.
So foragers have worked “by gut feel” for centuries, on poorly formalised signs like “after the thunderstorm, four days from now, head to the oak grove.” In some forests and seasons this works. At the level of a country and a year, it is a lottery.
With data the problem becomes solvable. If you have thousands of actually recorded fruiting events for one region tied to the weather on those days, you can find patterns in this data and predict the next flush. This is the problem ShroomCast exists to solve.
Data. The foundation
As of today’s release:
- 750K+ verified mushroom observations since 2019.
- 230+ regions covered by the model across Europe.
- 7+ years of weather data for each of these regions.
- 14 species modelled individually (chanterelle, porcini, morel, saffron milk cap, bay bolete, honey fungus and others).
We collect sources the same way every time: public observation databases plus our team’s own field records and trusted sources we work with directly. Every record is not just “found it on this day” but a triple (region, species, date) plus full weather and soil context around that day.
What we analyse
Each species in each region is modelled separately. Chanterelle has its triggers, morel has its own, porcini has its own. Within one model we look at five groups of features:
- Weather: air temperature, rainfall, humidity, atmospheric pressure, cloud cover.
- Soil: soil temperature, soil moisture, composition.
- Forest: type (coniferous, broadleaf, mixed), elevation, local microclimate.
- Natural cycles: lunar phases, seasonal patterns, species-specific fruiting windows.
- Historical dynamics: what happened in this region with this species in previous years under similar conditions.
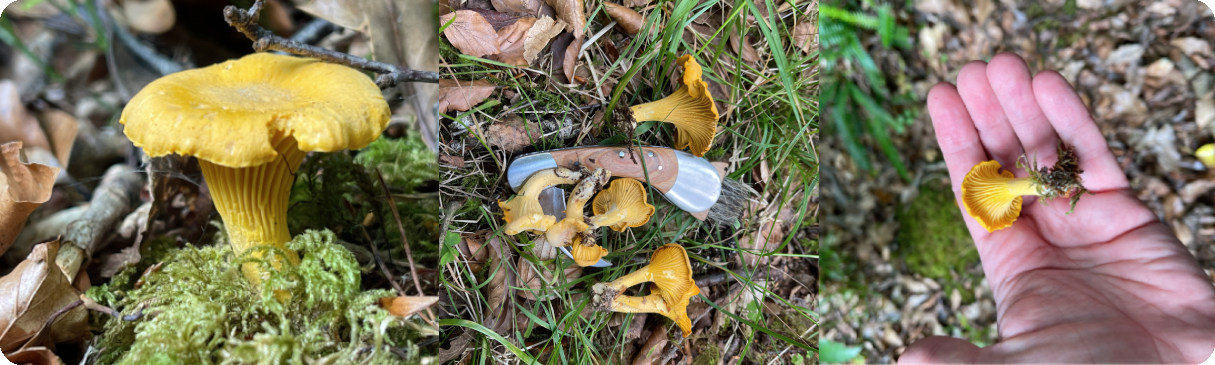
Case study: County Mayo, Ireland, chanterelle
To show how we pick a model, we will take one region and one species. Mayo is the ideal testbed for several reasons: a large pool of observations over many years (more than 4 000 for chanterelle alone), plus we supplemented the dataset with all-Ireland chanterelle data for context.
From 2019 to 2024 was our training period. The models “learned” on those six seasons: which combinations of weather and soil preceded actual fruiting events, which did not. We left 2025 untouched. That is the future no model had seen during training.
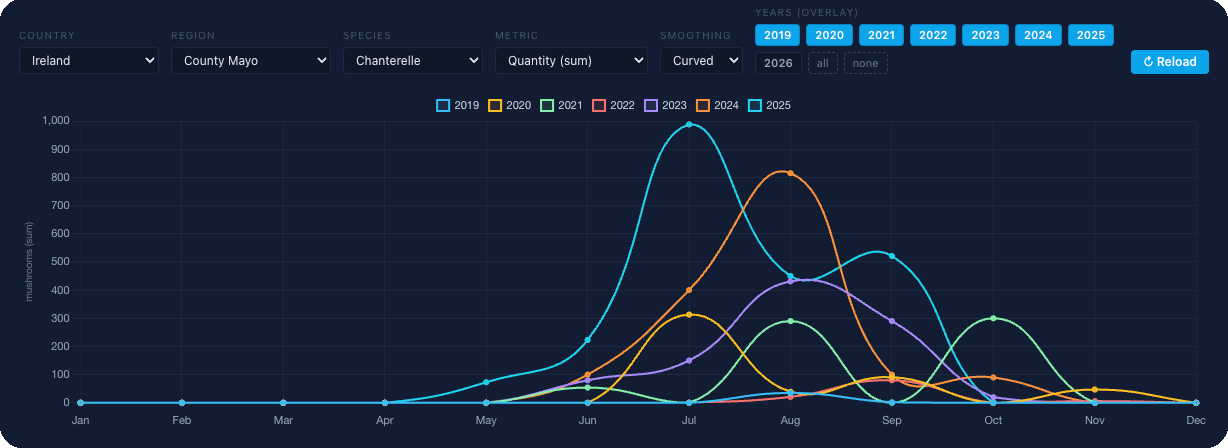
Every point on the chart above is either a find by our team or a verified observation from trusted sources we work with. No inferred data. Only what a human actually saw and recorded.
How we picked the model
This is the part most users never see: the model tender.
We ran more than 15 different ML architectures. Their specific names matter less than the approach itself: each model looked at the same data and had to learn to predict the probability of chanterelle fruiting in Mayo for every week of 2025. Within each architecture we tried dozens of variations: different feature horizons, different regularisation strategies, different ways of encoding seasonality.
The main selection rule: a model was judged not on how well it remembered the old data (any overfitted contraption can do that) but on how accurately it predicted 2025, the year it had not seen during training. That is the fair examination.
Model 1 vs Model 2
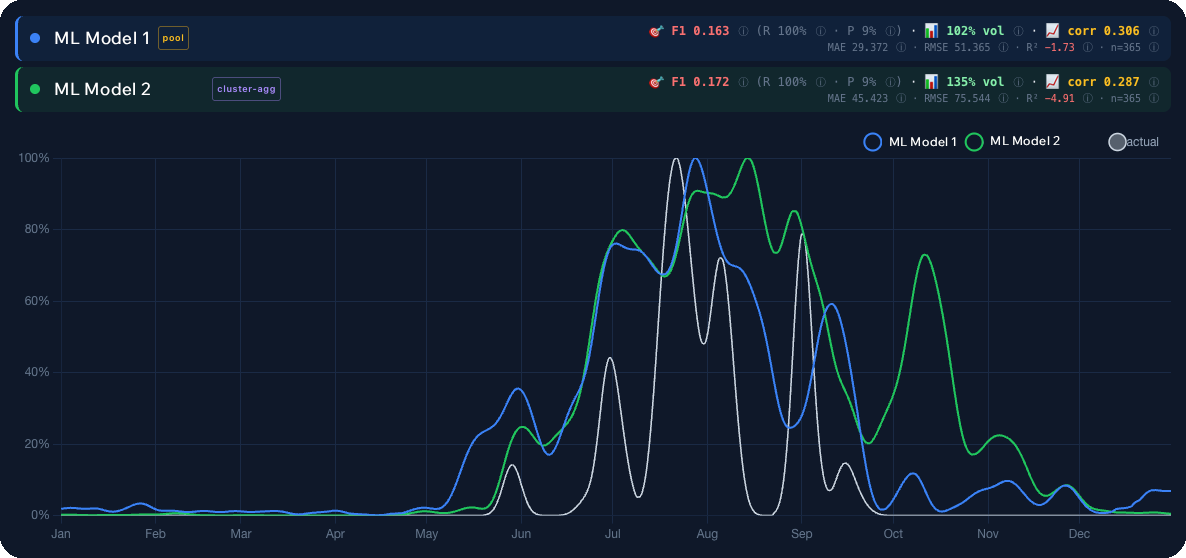
The chart above shows the same set of real 2025 observations, with predictions from two finalist models overlaid. The blue line (ML Model 1) tracks the real flushes cleanly: it catches the start of the season, does not miss the August peak, and decays correctly through October. The other variant either lags behind or overestimates intensity during “quiet” weeks.
The difference looks small on the eye but is enormous in practice. An extra “Excellent” forecast on a mushroom-free week costs you a wasted day and a tank of fuel. A missed peak costs you the season. So the winner was the model that, on average, misled the user the least on 2025.
We ran the same procedure for every species and for each of the 230+ regions. The same architecture did not win everywhere. In regions with a thinner observation base more conservative models won, in dense regions the more sensitive variants took the lead. The final production pipeline is assembled from these locally-optimal choices.
What actually ships in the app
The winning models run in production and now compute a 14-day forecast for every species in your region. Four times a day the pipeline pulls fresh weather, updates the features, runs the model and publishes the result. You see it as the colour-coded scale:
- 0-20% Very Low (purple, not today)
- 20-40% Low (blue, almost no chance)
- 40-60% Moderate (green, worth checking your usual spots)
- 60-80% High (yellow, conditions are good)
- 80-100% Excellent (orange, take the basket)
So everything that came out of thousands of hours of model training is five colours and one number per day. That is how it should be. Complex model, simple answer.
Where it works best and where it does not
Transparency is part of the product. Not every region has equally dense data, and we do not hide that.
Strongest: UK and Ireland. Here we have the highest density of observations and the longest species-level series. Mayo above is a picture of what a well-saturated region looks like.
Solid: the southern half of Sweden (Götaland and most of Svealand). We expanded coverage here recently and we are already getting a steady signal.
Weaker: northern Sweden (Norrland), especially subarctic Norrbotten. Fruiting windows are shorter, observations are fewer. The model still runs but the uncertainty band is wider. We surface this honestly in the app: where the data is thin, the forecast is more cautious.
This is not a flaw, this is how the problem is shaped. More data, sharper answers. Each season we add new observations and recalibrate the models.
Why a region, not a pin
One technical point that comes up regularly. ShroomCast deliberately does not show forecasts at specific points on the map. Only by regions (tens of square kilometres).
The reason is not technical. If the app said “in that clearing, 50 metres north of this turn, there is a 92% probability of chanterelle today”, a week later that clearing would no longer exist. Forests do not survive coordinate-led raids. So we work at the regional level and leave personal spots to foragers themselves.
ShroomCast does not store your locations. Does not remember where you walked. Does not build your personal map. This is by design, not by omission.
What is next
Right now coverage is UK, Ireland and Sweden. The next release is France, then continental Europe more broadly. We add new species as the observation base grows enough to support them (at least a couple of thousand validated observations per region, otherwise the model is meaningless).
Each new season we rerun the same examination we ran for Mayo: train on past years, test on the current one, pick the winners. This is not a one-off model launch, it is continuous recalibration.
In closing
Mushroom forecasting is not magic and not guesswork. It is an attempt to see the forest better than the calendar and intuition combined, while telling the user honestly where the model is confident and where it is not.
We do this because we are foragers ourselves. Everyone on the team has lost at least one day per season in an empty forest, and this product started as a way to stop losing those days. If that pain is familiar to you, try the forecast for your region.
Launch Special 2026
50% Off Your First Year of Premium! Subscribe to receive your exclusive promo code.
Available in Ireland, UK, Sweden & France · Germany coming soon
Name
Email*
Platform*